As temperature decreases, molecules of water vapor move a lot less. That is the kinetic energy of water molecules in water vapor decreases until such a point that these molecules no longer have enough energy to overcome the attractive forces between them. And so, these water molecules in vapor stick together (condenses) through attractive forces called hydrogen-bonds to form liquid water.
Because decreasing temperature causes a decrease in the average kinetic energy of molecules, we say there is a direct relationship between temperature in Kelvin and average kinetic energy.
So, decreasing temperature or cooling is viewed as removing energy from a substance. While increasing temperature or heating is viewed as adding energy to a substance.
Because of this when water vapor condenses, the CONDENSATION process, which releases energy to the surroundings is referred as an EXOTHERMIC process.
Now, let’s imagine that in an experiment you are to plot a graph of temperature versus energy as water vapor is cooled from 315 °C to about negative -25°C.
How would the graph look like?
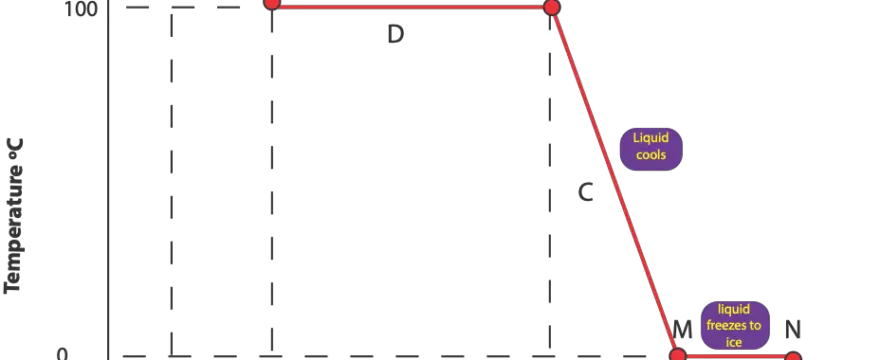
Here is how it would appear.

From the graph, as the temperature drops to about 100°C (condensation point), water vapor starts to condense to form liquid water. As the temperature stays the same at 100 °C, the average kinetic energy also stays same. However, the attractive forces between water molecules increase as water vapor transitions from the gaseous phase to the liquid phase, decreasing the potential energy between water molecules. Once liquid water forms, water molecules in liquid water continuous to move (rotate, vibrate, translate) slightly but not as much as in water vapor (gas).
To get solid water (ice), we must further decrease the temperature to strengthen the attractive forces between water molecules such that these molecules would only vibrate in their fixed positions.
To achieve the solid state, we will further cool our liquid to about 0 °C (freezing point). At 0 °C, liquid water starts to freeze. As the temperature stays the same at 0 °C, the average kinetic energy also stays same. However, the attractive forces between water molecules increase as liquid water transitions from the liquid phase to the solid phase, decreasing the potential energy between water molecules. Once ice forms, water molecules in ice would stay and vibrate in their fixed locations. Again, because freezing releases energy to the surroundings, it is referred as an EXOTHERMIC process.
To summarize —-
the molecular processes or physical changes involved when water vapor cools are Condensation and Freezing. These processes are physical changes because the same water molecules remain before and after condensation and freezing
The condensation region on the graph is longer than the freezing region because of this, more energy is released to the surroundings during condensation than in freezing.
Because both condensation and freezing release energy to the surroundings, they are referred as EXOTHERMIC
Because the temperature stays constant at the condensation and freezing point, the kinetic energy stays constant while the potential energy decreases at these points
From the graph —
The condensation point is the region from X to Y. The amount of energy that was put in or absorbed from the surroundings to boil liquid water is the same amount of energy released to the surroundings when water vapor condenses to liquid water, So, condensation and boiling occur at the same temperature.
The freezing point is the region from M to N. The amount of energy that was put in or absorbed from the surroundings to melt ice (solid water) is the same amount of energy released to the surroundings when water freezes. So, freezing and melting occur at the same temperature
Region E on the graph consists of only water vapor
Region D on the graph consist of water vapor (gas) and liquid water
Region C on the graph consist of only liquid water
Region B on the graph consist of liquid water and ice (solid water)
Region A consist of only ice (solid water)
To learn about the heating curve of water, click here
To learn about phase diagrams, click here.
