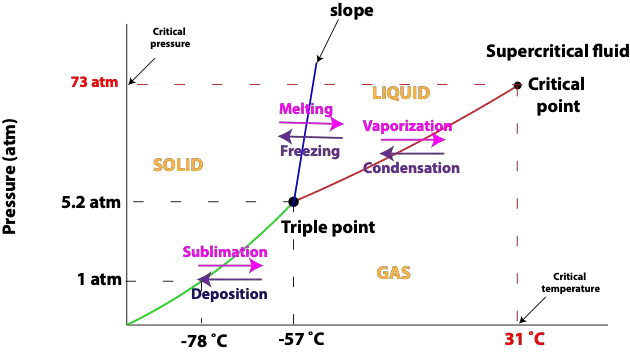
A phase diagram is a plot of pressure versus temperature that shows the phase (state) of a substance under differing conditions of temperature and pressure. Pressure and temperature can have an opposite effect on a substance. For instance, an increase in temperature while holding pressure the same causes more vapor to form, while a decrease in pressure while holding temperature the same causes more vapor to condense.
Phase diagrams are useful to material scientists and can be viewed as maps that defined the compositions of solutions or compounds when elements are combined under certain conditions of temperature and pressure.
Here is a phase diagram for carbon dioxide:

From the diagram,
- Regions represent states (phase) of a substance—solid, liquid, gas, and supercritical fluid
- Solid lines represent the temperature and pressure at which equilibrium exists between the two phases on either side of the line. From the diagram, the green line represents the sublimation and deposition curve. The blue line represents the melting and freezing point curve. The red line represents the vaporization and condensation curve. Sublimation is when atoms or molecules of a substance escape directly from the solid state to the gaseous state. The reverse process in which gas is converted directly to solid is called Deposition. Sublimation is an Endothermic process, meaning molecules of substance absorb energy from the surroundings to go directly from solid to gas. While Deposition is an Exothermic process, meaning molecules of substance give off energy (releases) to the surroundings to go from gas directly to solid. Vaporization is a process in which liquid turns into vapor or gas. The reverse process in which gas turns into liquid is called Condensation. Similarly, vaporization is Endothermic, while condensation is Exothermic. Freezing is when a liquid turns into a solid. The reverse process in which solid turns into liquid is Melting. Similarly, Freezing is Exothermic, while Melting is Endothermic.
- Triple point is the point at which all three phases are in equilibrium
- Critical point is the point at which the liquid and gas equilibrium curve cuts off. Conditions at the critical point are called critical pressure (Pc) and critical temperature (Tc). From the diagram, the critical temperature for carbon dioxide (CO2) is 31 °C and critical pressure is 73 atm. At temperatures above Tc, molecules have enough kinetic energy to break the attractive forces between them and no amount of pressure will cause these molecules to again act like liquid. At temperatures above critical temperature (Tc), a substance becomes a Supercritical fluid. Supercritical fluid density is light like liquid, and it flows like gas. As a result of these properties, supercritical fluids can easily diffuse through substances. Supercritical fluids are good solvents. For instance, supercritical carbon dioxide, which is nonpolar, easily dissolves nonpolar substances.
Now, here is the phase diagram for water:

From the phase diagram, notice at 760 mm Hg, which is same as 1 atm, the normal freezing point of water is 0 °C and the normal boiling point of water is 100 °C.
Let’s use the phase diagram for water to answer the following questions.
Starting from the triple point:
- When the pressure is held constant, and the temperature is increased to 25 °C, what phase exist?
- When the temperature is held constant and the pressure is increased to 30 mm Hg, what phase exist?
- When the pressure is held constant and the temperature is decreased to 0 °C, what phase exist?
To answer the above questions, proceed as follows.
For the first question, holding the pressure constant and increasing the temperature means moving your eyes slightly to the right from the triple point. Once you do, you will discover this is the gas region of the phase diagram. So, the answer for question (a) is gas
For the second question, holding the temperature constant and increasing pressure means moving your eyes slightly up the triple point. Once you do, you will notice this is the liquid region of the phase diagram. So, the answer for question (b) is liquid
For the third question, holding pressure constant and decreasing temperature means moving your eyes slightly to the left of the triple point. Once you do, you will notice this is the solid region of the phase diagram. So, the answer for question (c) is solid
